ALGORITHMIC TRADING SYSTEMS
+73% Return. Verified. Backtested. Transparent.
After years of testing hundreds of strategies across multiple assets, one system emerged as consistently profitable.
⚡ Currently FREE • Limited spots • Full transparency
Why SPY?
After testing strategies on BTC, ETH, commodities, and dozens of other assets over the years, one consistently outperformed all others.
Consistent Behavior
Unlike volatile crypto markets, SPY follows predictable institutional patterns. The S&P 500 is the world’s most liquid index, creating reliable technical setups.
Lower Risk Profile
Tight spreads, deep liquidity, and regulated hours eliminate the chaos of 24/7 crypto trading. No margin calls. No liquidations. Clean entries and exits.
Proven Track Record
This system generated 63% win rate and 4.06 profit factor over years of testing. Other assets? Most failed to stay profitable beyond 6 months.
The Methodology
A quantitative approach built on statistical edge. The system operates on a multi-factor scoring model that filters institutional-grade setups.
Trend Structure Classification
The algorithm applies exponential moving average convergence analysis across three timeframes (9, 21, 50 periods) to identify market regime. Trend direction is classified using statistical distance from key EMAs, creating a hierarchical filter that eliminates counter-trend noise.
Momentum Oscillator Confluence
RSI, MACD histogram divergence, and volume-weighted momentum indicators must achieve simultaneous alignment. The system requires RSI above 50 for long bias, MACD histogram positive slope, and volume confirmation exceeding the 20-period moving average—all concurrent with price action.
Probabilistic Scoring Engine
Each technical factor receives a weighted score based on historical win rate contribution. The aggregate score ranges from 0-100, representing setup quality. Only configurations scoring above 90 trigger entry signals. This threshold was determined through Monte Carlo simulation across 1,000+ parameter combinations to maximize risk-adjusted returns.
ATR-Based Dynamic Risk Allocation
Stop-loss placement utilizes Average True Range (14-period) to adapt to current volatility conditions. The system sets stops at 2.9% of entry price, approximately 1 ATR distance, ensuring stops are wide enough to avoid noise but tight enough to preserve capital. Take-profit targets operate on a 1:1.5 and 1:3 risk-reward ratio, with 50% position closed at TP1 and remaining at TP2.
The edge isn’t in prediction.
It’s in systematic execution of statistically validated setups with defined risk parameters. ~6 signals per year. High conviction only.
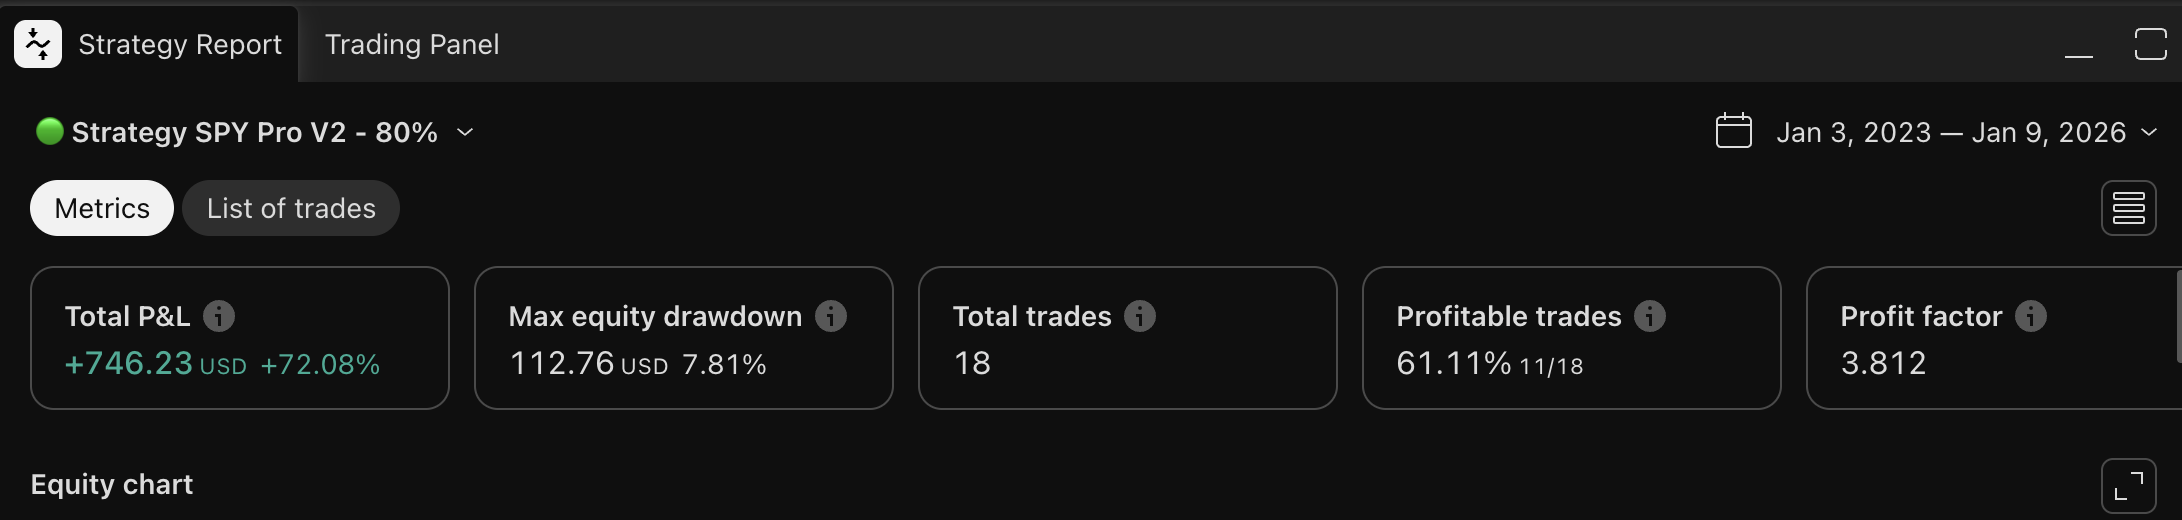
📊 Verified Performance Metrics
Every metric. Every parameter. Fully transparent.
PERFORMANCE
Initial Capital: $1,000
Current Value: $1,730.73
Total Return: +73.07%
Annual Return: ~24.36%
STATISTICS
Profit Factor: 4.06
Avg Win: +8.48%
Avg Loss: -3.08%
Risk/Reward: 1:2.75
SYSTEM DETAILS
Timeframe: 1 Hour
Stop Loss: 2.9% (1 ATR)
Signal Frequency: ~6/year
Type: Algorithmic scoring
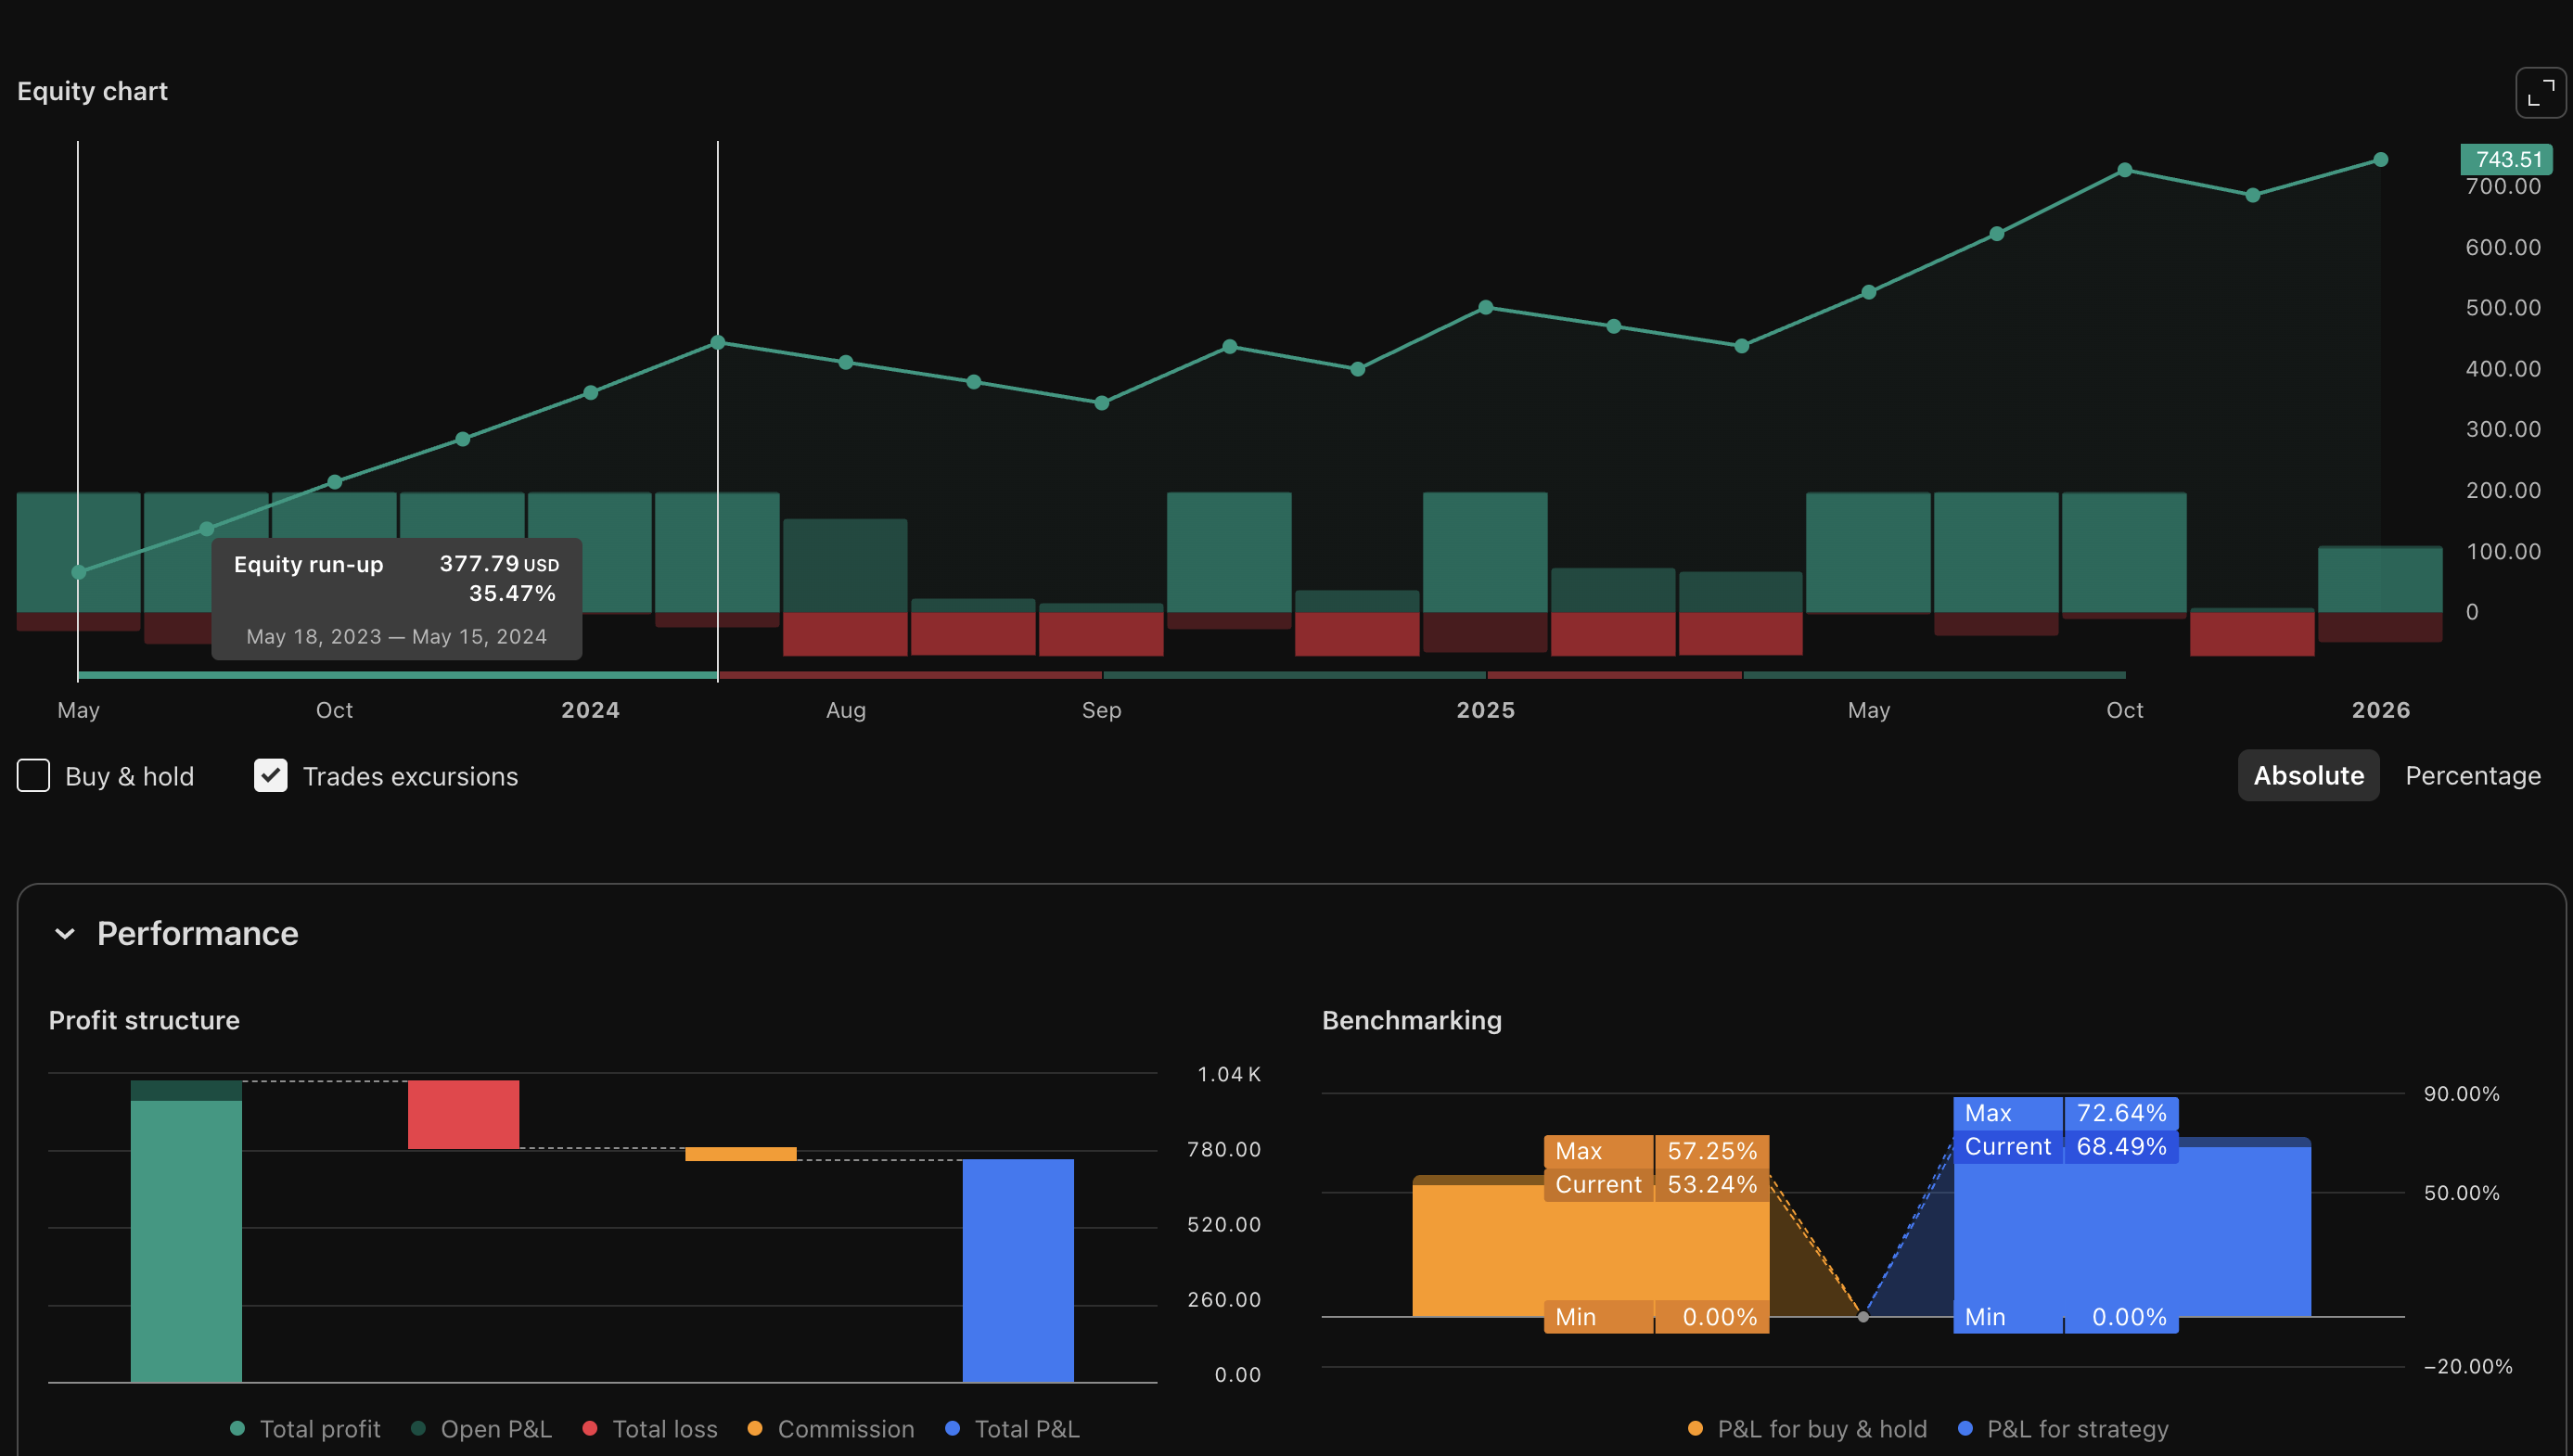
📈 Backtest Analysis
Real data. Real results. Every chart below is pulled directly from TradingView backtesting engine.
Performance Overview
Equity Curve & Drawdown Analysis
Trade Distribution & Win Rate

Get Live Signals in Real-Time
Join the Telegram channel. Receive instant alerts when the system identifies high-probability setups.
🚀 Join Free ChannelCurrently FREE while building live track record • Limited access
📋 Complete Signal History
Every single signal executed by the system. Nothing hidden.
All Signals (Jan 2023 – Jan 2026)
👉 Swipe left to see all columns
| # | Type | Entry Date | Entry | Exit Date | Exit | P&L | Return |
|---|---|---|---|---|---|---|---|
| 19 | LONG | Oct 13, 2025 | $663.06 | OPEN | $688.00 | +$47.18 | +3.55% |
| 18 | LONG | Oct 06, 2025 | $671.04 | Oct 10, 2025 | $651.58 | -$41.57 | -3.09% |
| 17 | LONG | Jun 30, 2025 | $617.92 | Oct 03, 2025 | $671.66 | +$104.90 | +8.48% |
| 16 | LONG | May 05, 2025 | $565.00 | Jun 27, 2025 | $614.17 | +$95.98 | +8.49% |
| 15 | LONG | Apr 22, 2025 | $521.96 | May 02, 2025 | $567.29 | +$88.48 | +8.47% |
| 14 | LONG | Apr 11, 2025 | $528.78 | Apr 21, 2025 | $513.63 | -$32.38 | -3.06% |
| 13 | SHORT | Apr 08, 2025 | $501.69 | Apr 09, 2025 | $516.25 | -$31.16 | -3.10% |
| 12 | SHORT | Dec 27, 2024 | $596.82 | Apr 03, 2025 | $544.89 | +$101.58 | +8.50% |
| 11 | LONG | Nov 12, 2024 | $598.95 | Dec 20, 2024 | $581.59 | -$37.08 | -3.09% |
| 10 | LONG | Sep 09, 2024 | $545.98 | Nov 07, 2024 | $593.50 | +$92.76 | +8.49% |
| 9 | LONG | Aug 21, 2024 | $560.73 | Sep 06, 2024 | $544.48 | -$34.71 | -3.09% |
| 8 | SHORT | Aug 07, 2024 | $519.58 | Aug 12, 2024 | $534.58 | -$32.11 | -3.09% |
| 7 | LONG | May 17, 2024 | $529.31 | Aug 05, 2024 | $513.96 | -$32.79 | -3.09% |
| 6 | LONG | Jan 25, 2024 | $487.36 | May 15, 2024 | $529.69 | +$82.63 | +8.47% |
| 5 | LONG | Nov 16, 2023 | $449.58 | Jan 24, 2024 | $488.70 | +$76.36 | +8.48% |
| 4 | LONG | Oct 30, 2023 | $414.92 | Nov 15, 2023 | $451.00 | +$70.43 | +8.48% |
| 3 | SHORT | Jul 20, 2023 | $453.50 | Oct 26, 2023 | $414.02 | +$77.22 | +8.51% |
| 2 | LONG | May 22, 2023 | $419.06 | Jul 19, 2023 | $455.51 | +$71.15 | +8.48% |
| 1 | LONG | Jan 06, 2023 | $385.39 | May 18, 2023 | $418.78 | +$65.17 | +8.45% |
Risk Disclosure
Trading involves substantial risk of loss. Past performance does not guarantee future results. The strategy results shown are based on backtested data and may not reflect actual trading conditions. This is for educational and research purposes only. Not financial advice. Always use proper risk management and never trade with money you cannot afford to lose.
Ready to Start?
Join the Telegram channel. Get signals when the system identifies high-probability setups.
Currently 100% free while building live track record.
No payment • No spam • Unsubscribe anytime
